28. 5. 2022
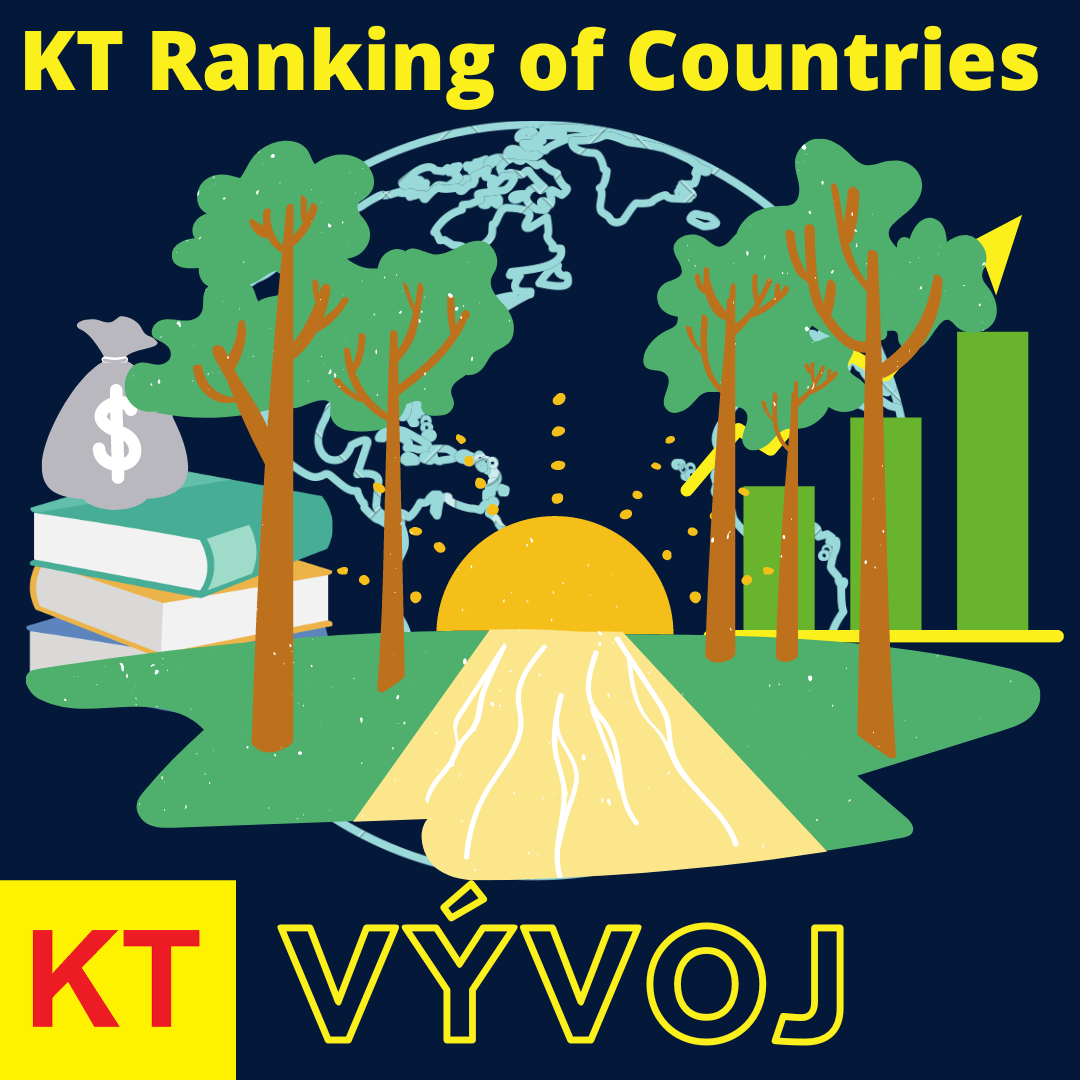
KT Ranking of Countries 2020
Menu EN, CZ, DE, IT: here
Submenu EN: here
EN: here
CZ: here
DE: here
IT: here
KT Ranking of Countries
Source: the topics.
KT Vývoj (KT Development), Karel Tichý, 28 May 2022
Evaluation of 24 selected countries according to the following five criteria:
In this quality of life ranking, 24 countries are in all-play-all format in an imaginary competition. For winning over his opponent in each of the five criteria above, the winner receives 1 small point. If a country defeats its opponent in all five ratings, the result of the match is 5-0. The winner of the match receives 5 small points (score) and 1 big point for winning the match. If a country defeats another one in three of the ratings, the score is 3-2 and the winner has 3 small points (score) and 1 big point. Method of the evaluation: 1st Number of big points; 2nd Number of small points (score); 3rd Head-to-head record.
For comparison, the evaluation is carried out first in 2000 and then, twenty years later, in 2020. It is interesting to see how the ranking of the countries has changed over the past 20 years. The winners of 2000: 1st Japan, 2nd Canada, 3rd Sweden. The winners of 2020: 1st Sweden, 2nd Australia, 3rd Canada. The UK improved its position from 10th place to 8th place, gaining 3 big points and 3 small points more. The USA, on the other hand, worsened its position from 4th place to 7th place. The biggest worsening was in the position of Mexico - from 13th place with 48 score points in 2000 to 18th place with 30 score points in 2020.
KT Ranking - Comparison 2000 and 2020
|
xxx
|
2000 |
xxx
|
xxx
|
xxx
|
xxx
|
2020 |
xxx
|
|
|
1.
|
Japan
|
101:14
|
23
|
xxx
|
1.
|
Sweden
|
101:14
|
23
|
|
2.
|
Canada
|
100:15
|
21
|
xxxx
|
2.
|
Australia
|
98:17
|
21
|
|
3.
|
Sweden
|
99:16
|
21
|
xxxx
|
3.
|
Canada
|
96:19
|
21
|
|
4.
|
USA
|
85:30
|
20
|
xxxx
|
4.
|
Japan
|
95:20
|
19
|
|
5.
|
Austria
|
91:24
|
18
|
xxxx
|
5.
|
Austria
|
94:21
|
19
|
|
6.
|
Australia
|
91:24
|
18
|
xxxx
|
6.
|
Germany
|
90:25
|
18
|
|
7.
|
Germany
|
89:26
|
18
|
xxxx
|
7.
|
USA
|
84:31
|
18
|
|
8.
|
Italy
|
87:28
|
16
|
xxxx
|
8.
|
UK
|
81:34
|
17
|
|
9.
|
France
|
80:35
|
16
|
xxxx
|
9.
|
France
|
76:39
|
14
|
|
10.
|
UK
|
78:37
|
14
|
xxxx
|
10.
|
Italy
|
75:40
|
14
|
|
11.
|
Spain
|
70:45
|
13
|
xxxx
|
11.
|
Spain
|
75:40
|
14
|
|
12.
|
Czechia
|
66:49
|
12
|
xxxx
|
12.
|
Czechia
|
72:43
|
12
|
|
13.
|
Mexico
|
48:67
|
11
|
xxxx
|
13.
|
Poland
|
58:57
|
11
|
|
14.
|
Poland
|
53:62
|
10
|
xxxx
|
14.
|
Slovakia
|
52:63
|
10
|
|
15.
|
Slovakia
|
53:62
|
9
|
xxxx
|
15.
|
Turkey
|
33:82
|
9
|
|
16.
|
China
|
31:84
|
8
|
xxxx
|
16.
|
China
|
39:76
|
8
|
|
17.
|
Brazil
|
36:79
|
7
|
xxxx
|
17.
|
Brazil
|
32:83
|
7
|
|
18.
|
Turkey
|
28:87
|
6
|
xxxx
|
18.
|
Mexico
|
30:85
|
6
|
|
19.
|
Russia
|
25:90
|
5
|
xxxx
|
19.
|
Russia
|
27:88
|
5
|
|
20.
|
Philippines
|
20:95
|
4
|
xxxx
|
20.
|
Indonesia
|
23:92
|
4
|
|
21.
|
South Africa
|
15:100
|
3
|
xxxx
|
21.
|
South Africa
|
22:93
|
3
|
|
22.
|
Indonesia
|
21:94
|
2
|
xxxx
|
22.
|
Philippines
|
16:99
|
2
|
|
23.
|
India
|
9:106
|
1
|
xxxx
|
23.
|
India
|
8:107
|
1
|
|
24.
|
Pakistan
|
4:111
|
0
|
xxxx
|
24.
|
Pakistan
|
3:112
|
0
|
Differences 2000 - 2020:
Biggest rise: China (+8 score points, before 31, after 39), Australia (+7 points, before 91, after 98), South Africa (+7 points, before 15, after 22), Czechia (+6, before 66, after 72), Spain (+5), Poland (+5) and Turkey (+5).
Biggest descent: Mexico (-18 score points, before 48, after 30), Italy (-12 points, before 87, after 75), Japan (-6 points, before 101, after 95), Philippines (-4), France (-4), Canada (-4) and Brazil (-4).
KT 2000 - data:
Human Development Index (2000). Life Expectancy (2000). Allianz Global Wealth Report (2012). GPI - The Safest Countries in the World (2008). GDP per capita (2000).
KT 2020 - data:
Human Development Index (2019). Life Expectancy (2020). Allianz Global Wealth Report (2020). GPI - The Safest Countries in the World (2020). GDP per capita (2020).
#RankingOfCountries